mouse-trail
Category
Miscellaneous
Points
142
Tags
So we got a .txt file called mouse_movements.txt
mouse_movements.txt:
❯ cat mouse_movements.txt | head

731,762

799,704

636,696

720,761

1703,781

1983,731

509,717

1732,802

595,744

556,702 To solve this, we need an library called matploitlib for drawing plot from the data, and here it is the solver.
import matplotlib.pyplot as plt

input_file = 'mouse_movements.txt'
x_coords = []
y_coords = []

try:
    with open(input_file, 'r') as f:
        for line in f:
            try:
                x, y = map(int, line.strip().split(','))
                x_coords.append(x)
                y_coords.append(y)
            except ValueError:
                print(f"Melewati baris yang tidak valid: {line.strip()}")

    plt.figure(figsize=(10, 8))
    plt.scatter(x_coords, y_coords, s=5)
    plt.gca().invert_yaxis()
    plt.title('Visualisasi Pergerakan Mouse')
    plt.xlabel('Koordinat X')
    plt.ylabel('Koordinat Y')
    plt.grid(True)
    plt.savefig('mouse_plot.png')
plt.show()output:
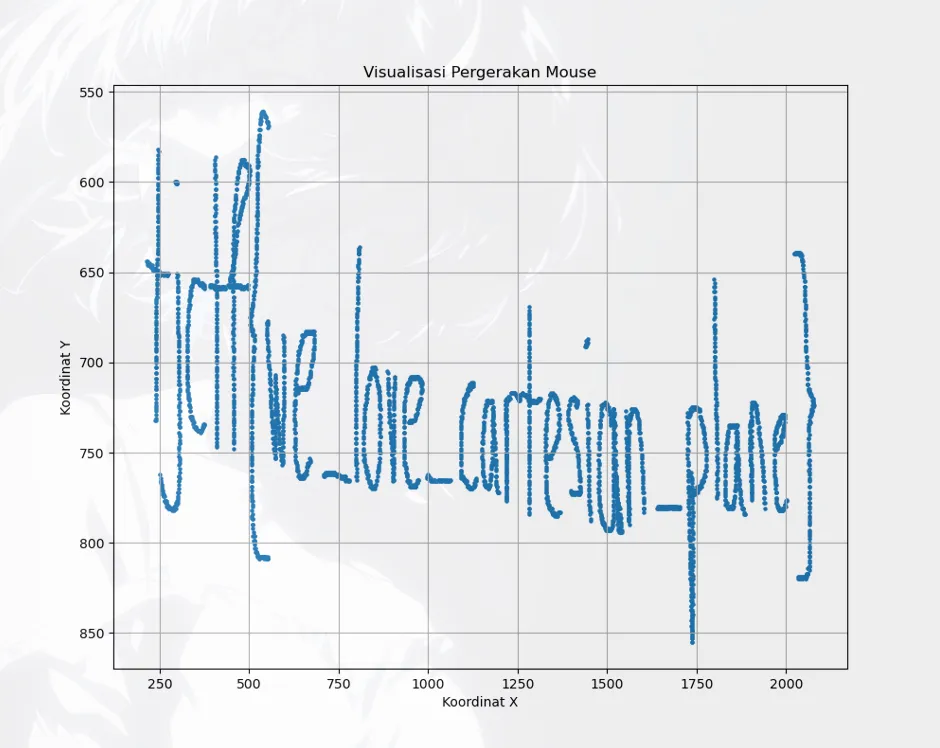
mouse-trail Flag:
tjctf{we_love_cartesian_plane}